Streamlit app
Analyze
Graphical frontend for the Analyzer stored procedures — create point-in-time snapshots of source tables and view column statistics directly in the browser.
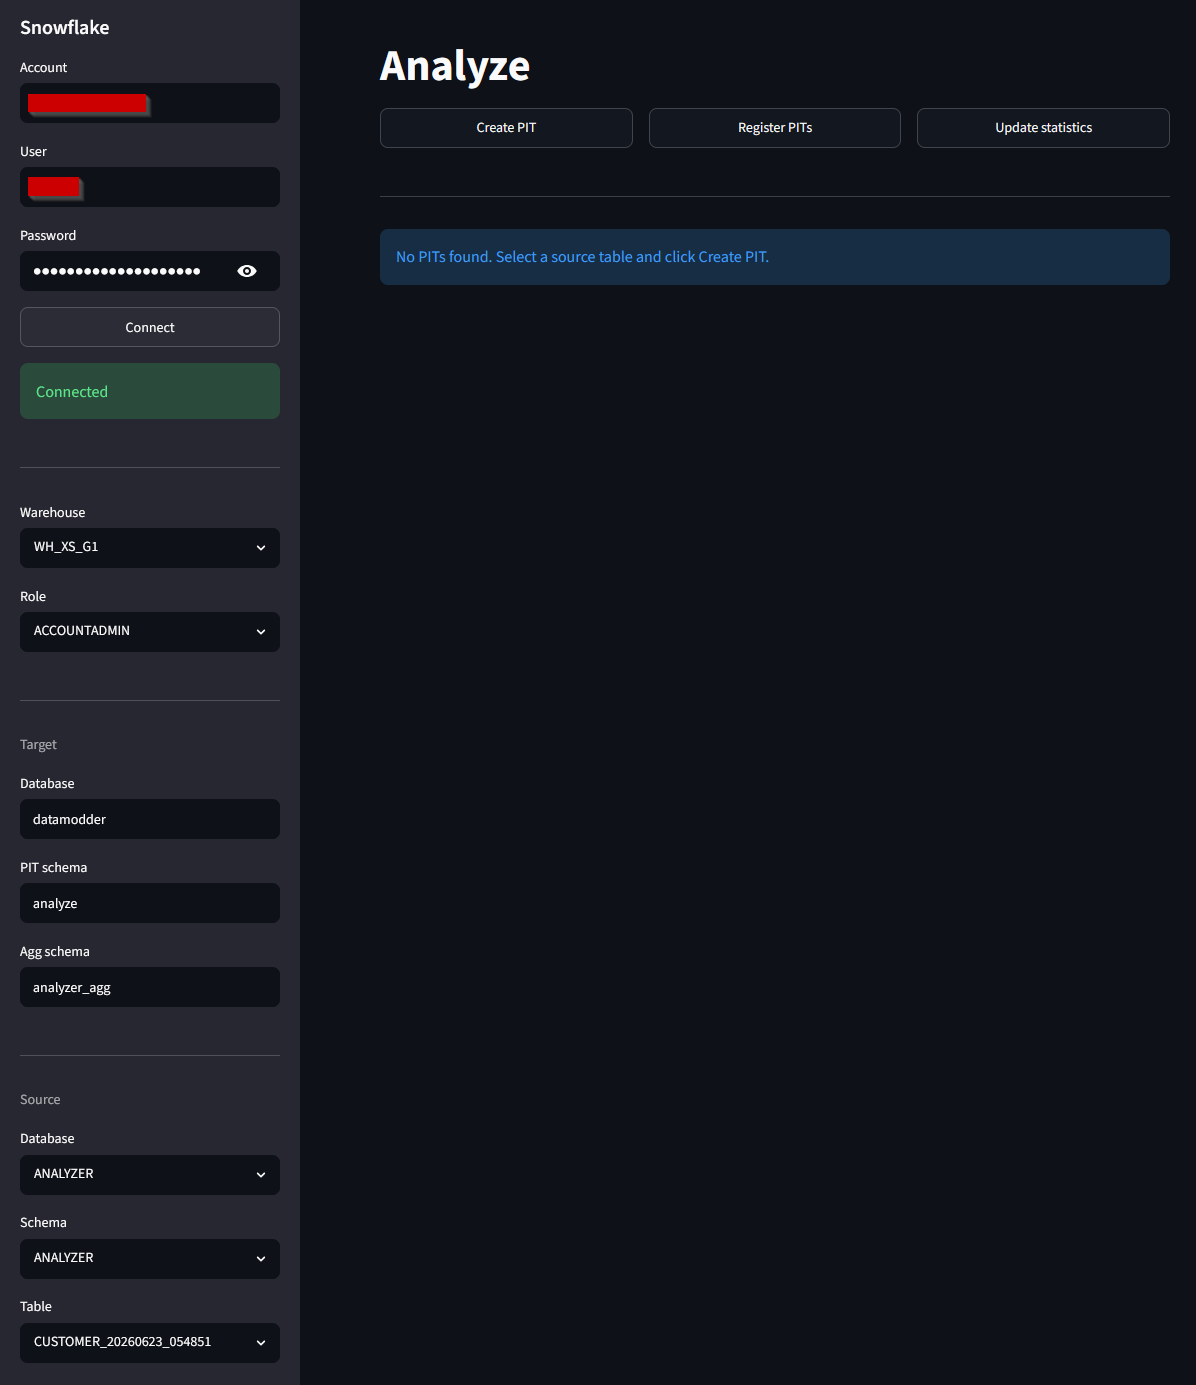
Goal
The Analyzer stored procedures are powerful but require manual SQL calls with session variables. This app makes that process visual: you select a table, click a button, and the app calls the right procedure with the correct variables — including an overview of all snapshots and their statistics.
Statistics are displayed with conditional formatting: columns with nulls get a yellow background, columns outside the expected range get a red one.
Actions
| Button | Procedure | Description |
|---|---|---|
| Create PIT | create_pit(db, schema, table) | Creates a snapshot table named {TABLE}_{YYYYMMDD}_{HH24MISS} in the PIT schema. |
| Register PITs | register_pits() | Scans the PIT schema and registers all snapshot tables in the metadata. |
| Update statistics | update_statistics() | Calculates column statistics for all registered PITs. |
Configuration
Default values match the datamodder_utils setup:
| Field | Default | Description |
|---|---|---|
| Database | datamodder | Snowflake database where the analyze schemas are located. |
| PIT schema | analyze | Schema where snapshot tables are created. |
| Agg schema | analyzer_agg | Schema where the statistics aggregation table is located. |
Usage
1. Start the app
streamlit\analyze\start.cmd
2. Connect to Snowflake
Enter your account, username and password in the sidebar. The app stores account and username in ~/.streamlit_sources.json and the password via Windows Credential Manager.
3. Select source and run actions
Choose database, schema and table. Use the buttons to create a PIT, register it or update statistics. Then select a PIT from the list to view the column statistics.